AI Decision Intelligence for Blood Drive Operations
created for

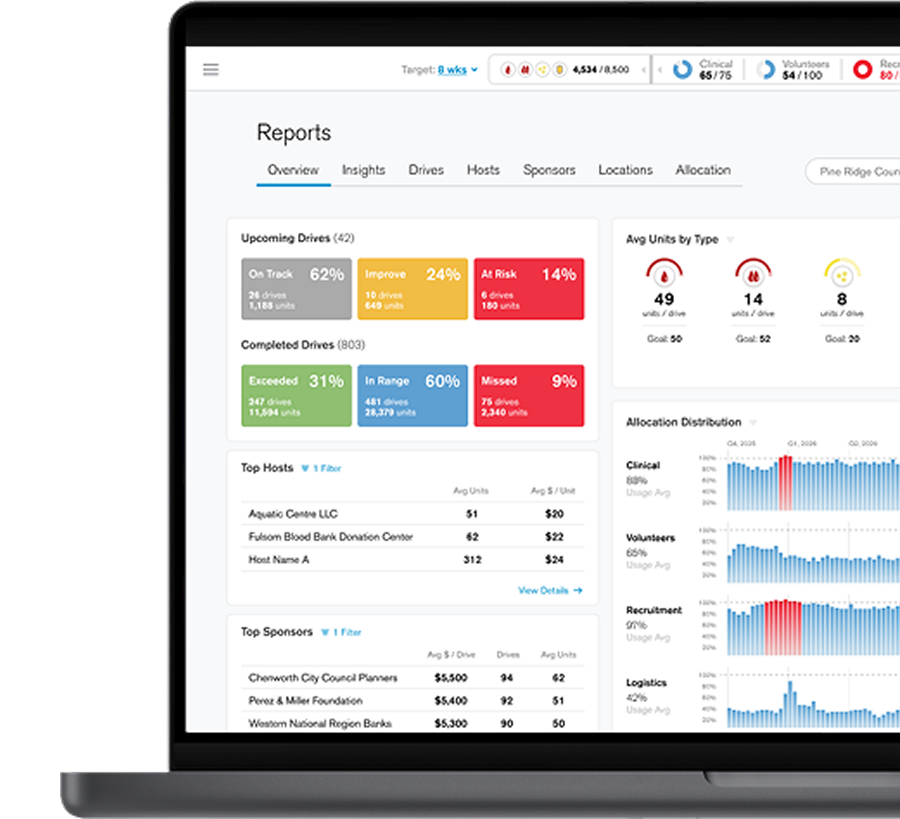
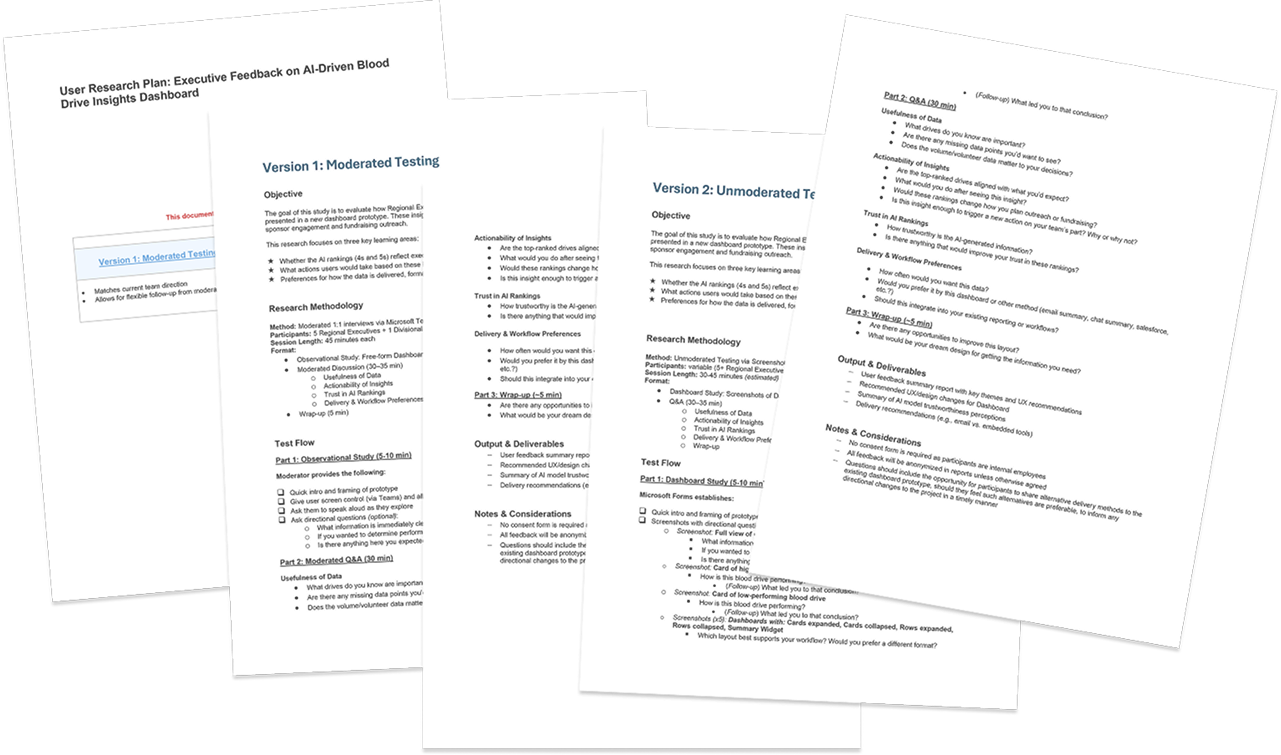
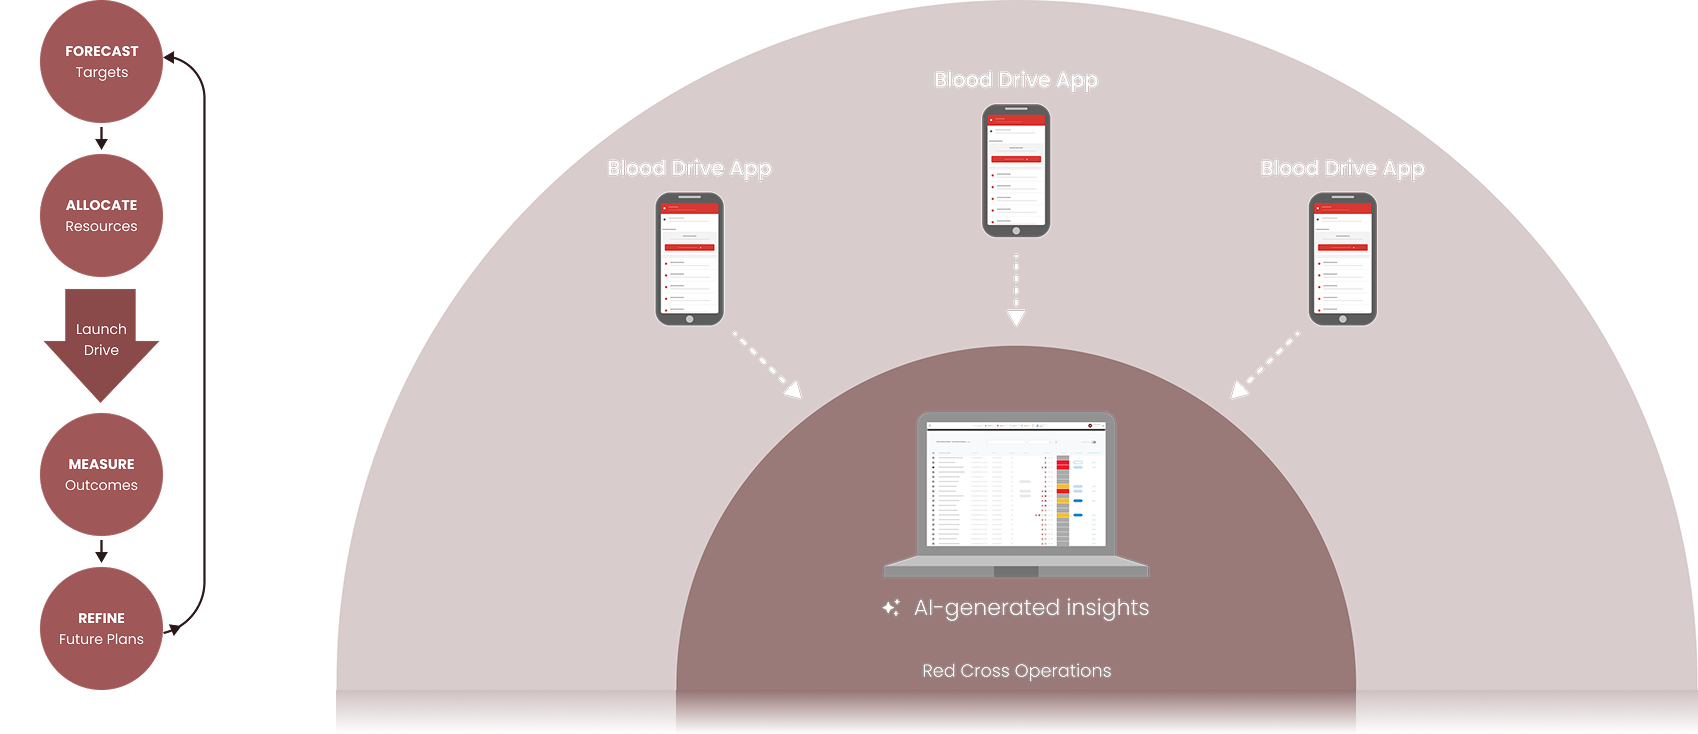
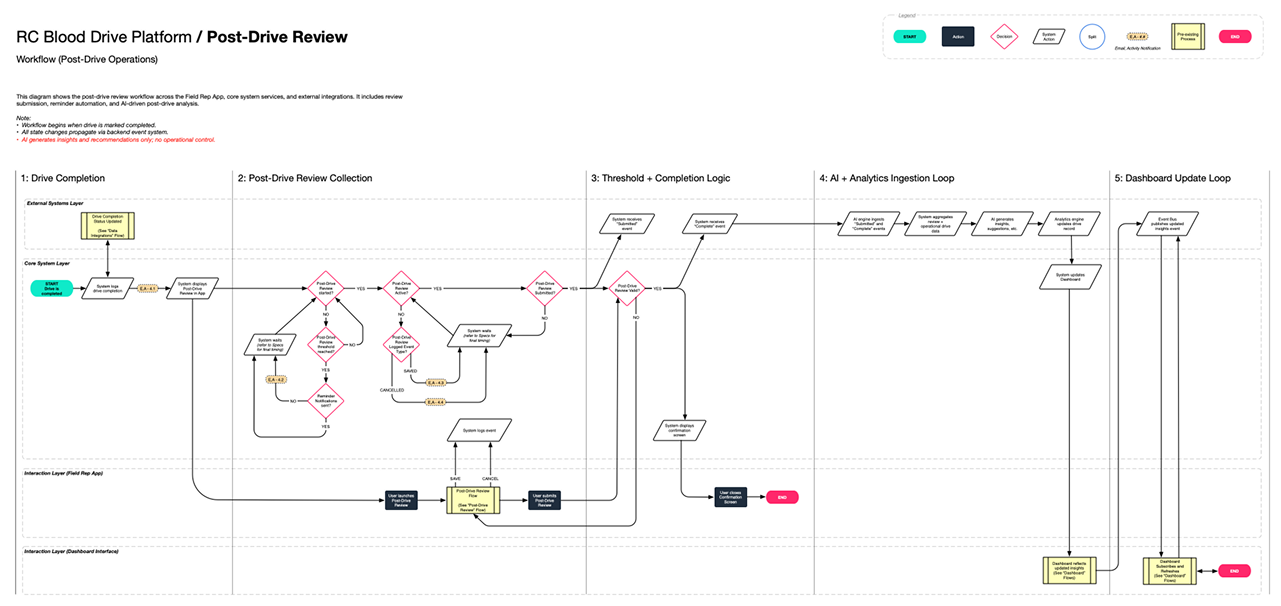
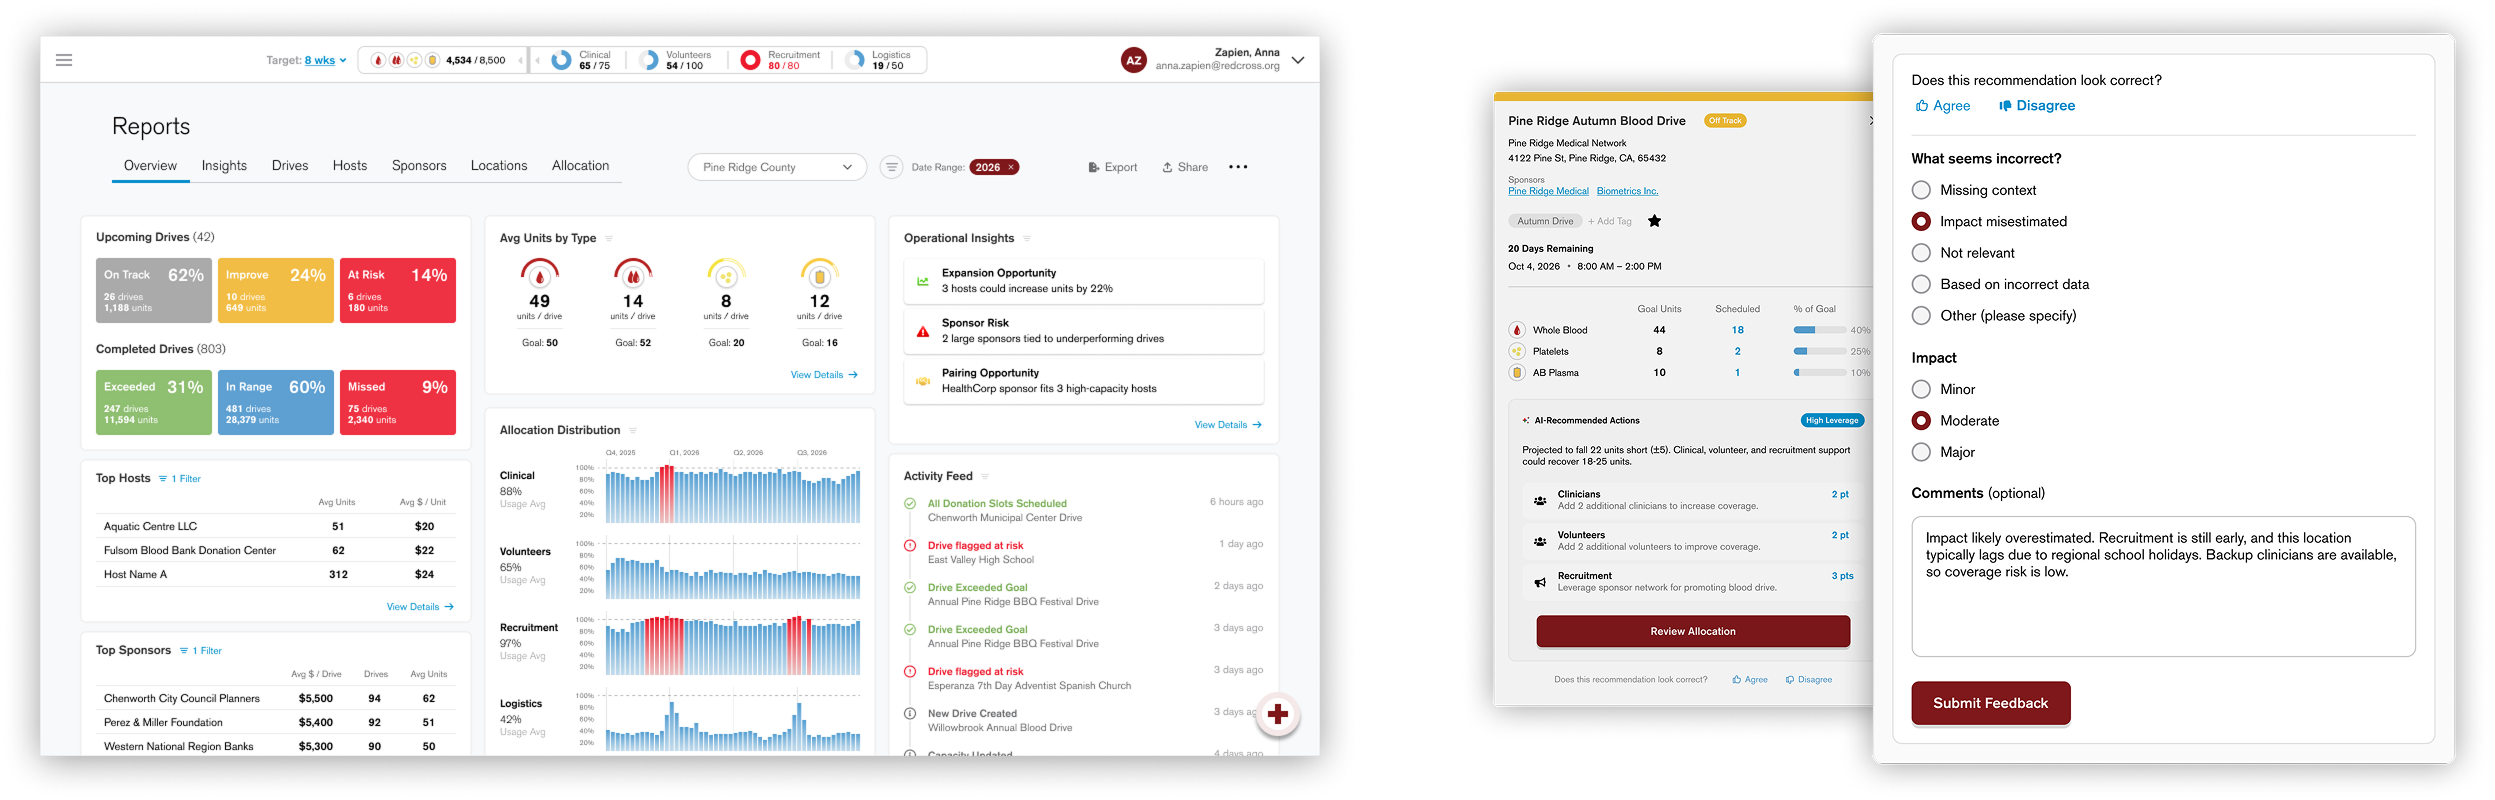
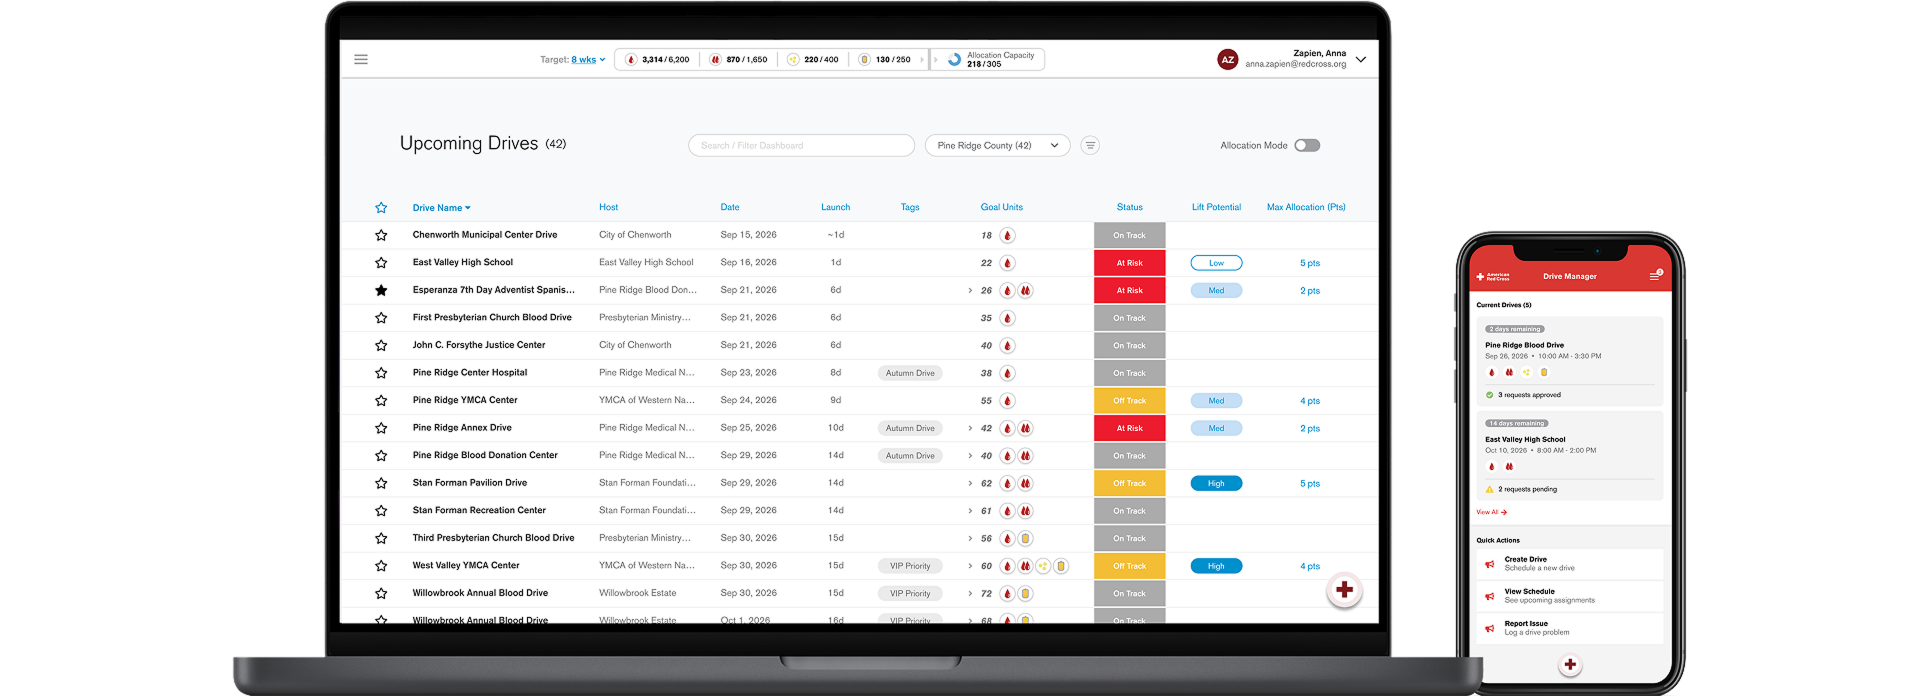
Designed an AI-supported planning platform for blood drive operations, unifying forecasting, resource allocation, field reporting, and performance tracking into a single operational decision environment. The platform transformed fragmented planning workflows into a unified decision system supporting operational visibility, explainable AI recommendations, and coordinated decision-making across regional blood services teams.
My Role: Lead Product Designer
Timeframe: 2025–Present
SERVICE DESIGN
SYSTEMS UX
OPERATIONS
AI WORKFLOWS